SJR 385
Commission on Educational Accountability
September 10, 2001, Richmond
The September 10 meeting of the Commission on Educational Accountability focused on public opinion on Virginia schools and education, the effectiveness of remedial summer school programs, the findings of academic review teams addressing Virginia public schools accredited with a warning, and Virginia's scores on the National Assessment of Educational Progress (NAEP).
Poll Results
VCU's Commonwealth Educational Policy Institute's Commonwealth Education Poll targeted Virginians' opinions regarding public education in the Commonwealth. Neither region of residence nor property ownership status affected responses to the survey questions, which were posed to 814 adults in mid-April of this year.
Commonwealth Education
Poll - May 2001
"Is this a problem for public schools in your community?"
|
Major
Problem (%) |
Minor
Problem (%) |
No
Problem (%) |
Don't
Know/
No Answer (%) |
|
| Lack of parent involvement |
56
|
27
|
10
|
7
|
| Overcrowded classrooms |
51
|
30
|
11
|
8
|
| Student use of alcohol/drugs |
42
|
35
|
10
|
14
|
| Violence in the schools |
30
|
48
|
15
|
7
|
| Poor quality teachers |
26
|
41
|
24
|
10
|
| Buildings unsafe/unhealthy |
16
|
41
|
35
|
8
|
A majority of respondents—52 percent—indicated the "positive impact" of education reform in Virginia; only 16 percent of respondents feel that public education has declined in the last five years. The greatest positive impact was reported by lower-income families. Only 30 percent of Virginia households are responsible for the 1.2 million school-age children in the Commonwealth, and parents of schoolchildren tended to respond more favorably regarding public education. While most parents feel the quality of public education has stayed the same or improved, only 17 percent feel this quality has declined. Similar patterns of response came from families with school employees.
Responses were more evenly divided regarding whether the Standards of Learning (SOL) assessments have helped improve school performance: 16 percent of respondents indicated the tests have supported improvement "a lot," while 36 percent indicate these tests have helped "a little," and 31 percent responded that the assessments have not improved public education. Forty-four percent of respondents are very or somewhat confident that the SOL assessments are "an accurate indicator of student progress and school achievement"; 46 percent have little or no confidence in the validity of the tests.
Identified by an overwhelming 82 percent of respondents as critical to improving student achievement was smaller class size. Continuing training for teachers was valued by about 60 percent. Also seen as helping student performance—"a lot" by 51 percent and "a little" by 26 percent—was improved teacher compensation.
Perceptions regarding school funding were very clear: about 70 percent feel it is insufficient, and 57 percent of respondents were willing to pay higher taxes to increase funding for public education. An increased sales tax was supported by 47 percent, with the income tax and personal property tax garnering only 16 and 13 percent, respectively. Perceived areas of most critical need included teacher salaries and school construction and maintenance. Lack of parental involvement is perceived as the most pressing challenge in public education, followed by overcrowded classrooms.
Character education is seen as very important and somewhat important by 72 and 22 percent of respondents. That parents and schools should share responsibility for this education is supported by 46 percent; 53 percent feel that only the parent should have this primary responsibility.
Summer School
Challenges in research design for studies of remedial summer school initiatives are variations in program duration, student attendance, teacher training, continuity with regular school curriculum, parental involvement levels, and planning time. In addition, variations in measures of remediation success—such as grades or standardized tests—create challenges in assessing the effectiveness of remedial programs.
A review of 31 studies of the effect of summer school on the achievement of at-risk secondary students in 12 states indicated the same effects for gender. High school and elementary school students showed greater gains than did middle school students; students of middle- and high-socioeconomic status showed greater improvement. Also showing the greatest improvement were rural, suburban, and small communities.
Program characteristics contributing to effectiveness were focus on deficiencies, required rather than voluntary attendance, smaller class size, individualized rather than group instruction, parental involvement, licensed rather than unlicensed teachers, and collaborative planning. Greater gains are noted with 60 to 100 instructional hours, and math witnessed greater gains than English. Other recommendations for effective remediation included completing remediation close to the beginning of the subsequent school year, requiring formative and longitudinal evaluations, providing adequate teacher planning time, and ensuring local control to facilitate necessary adaptations.
The MERC summer remediation study will examine the progress of ninth graders failing one or more SOL assessments this past spring. The study will incorporate a pretest-posttest model for ninth grade students failing a spring 2001 SOL assessment required to attend summer school, and a pretest-posttest for a comparison group, where possible, for those ninth graders failing an SOL assessment who did not attend summer school.
Accreditation
Academic Review Teams visited 211 schools accredited with warning between November 15, 2000, and February 27, 2001. Of these 211 schools, 186 received the warning status due to failing scores in mathematics, English, or both. Spending three to five days visiting classrooms (for a total of 796 review days) talking with teachers, and reviewing documents, these teams of two each prepared a report for each school detailing strengths, noting areas requiring improvement, and suggesting school improvement planning in curriculum alignment, use of instructional time and scheduling practices, use of data in making instructional and planning decisions, and professional development. The review teams analyzed systems, practices, and policy, rather than individual personnel. In turn, this evaluation process was itself reviewed by principals and teachers.
Curriculum alignment—the match between the Standards of Learning curriculum and local written curriculum taught in the classroom—was cited as an area of improvement in 87 percent of the reviewed schools. Most frequently noted was the alignment of the local written curriculum, the incorporation of resource guides into this local curriculum, and the pacing of instruction. Suggestions included ensuring teacher use of resource guides and using student performance data to adjust the pacing of instruction.
Appearing as an area for improvement in 77 percent of schools accredited with a warning was the use of time and school scheduling practices. Most frequently cited as needing improvement were adequate instructional time to accommodate a variety of teaching methods, providing intervention or remediation during the school day, and enhancing teacher planning and collaboration on instructional concerns.
Use of data to make instructional and planning decisions was cited as an area for improvement for 83 percent of the reviewed schools. Most often noted for improvement were using data to make various instructional decisions, training staff in data analysis, and disaggregating data. Professional development opportunities required improvement in 79 percent of schools, with the use of data to identify professional development needs and the inclusion of peer modeling, coaching, and problem-solving in these initiatives.
An overwhelming majority of principals—92 percent—and 76 percent of teachers agreed that the purpose of the academic review process was clear, the allotted time sufficient, and data collection methods appropriate. In assessing the implementation of the academic review, 97 percent of principals and 88 percent of teachers agreed that the process was conducted fairly and objectively and in an organized, nondisruptive manner. When asked if the reviewed school could conduct its own academic review, 87 percent of principals and 71 percent of teachers agreed, and also reported the review findings useful, the school's needs assessed, and review purposes achieved. Recommendations for schools generally included the development of comprehensive curriculum guidelines, training for teachers in methodology, use of data, and professional development tailored to individual school needs. In providing future technical assistance, the Department of Education will make adjustments to the academic review process based on the data, develop next steps, and assist in curriculum development and other local efforts.
Commission discussion focused on the need to support the Department of Education in its efforts to provide analysis and technical assistance to these schools and also cited the need for disaggregated test score data in the "evolving" SOL testing process.
NAEP Scores
Virginia students' scores on National Assessment of Educational Progress (NAEP) showed "dramatic gains" for mathematics for fourth and eighth graders. A Congressionally mandated project of the National Center for Education Statistics, U.S. Department of Education, NAEP selects nationally representative samples of students from the 40 participating states to take the assessment. Approximately 2,500 Virginia students from 100 schools and each tested grade level participated.
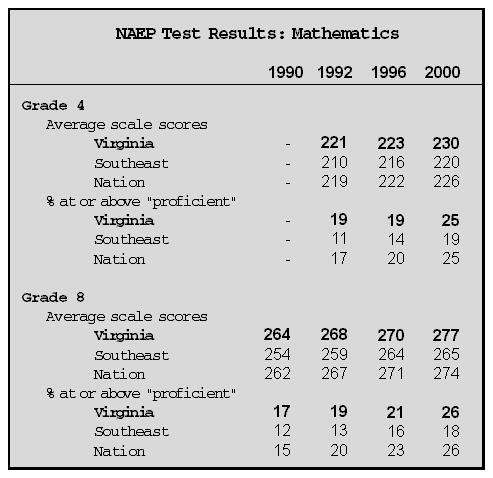
Mathematics scores for African-American and Hispanic students also showed improvement. An 11 percent and a seven percent increase in test scores in 1992 and 1996, respectively, was achieved by fourth grade Hispanic students, with 59 percent rated at or above basic achievement in 2000. Similarly, 56 percent of Hispanic eighth graders achieved this rating in 2000, up from 44 percent in 1992 and 1996 and 31 percent in 1990.
Scores for Virginia's African-American students consistently surpass those of African-Americans nationwide. In 2000, 46 percent of African-American fourth graders rated "at or above basic achievement," compared to 34 and 25 percent in 1996 and 1992, respectively. A total of 38 percent of African-American eighth graders achieved this rating in 2000, up from 26 percent in 1996, 29 percent in 1992, and 26 percent in 1990.
The Honorable Emmett W. Hanger,
Jr., Chairman
Legislative Services contact: Kathleen G. Harris