HJR 685/SJR 387
Joint Subcommittee to Study and Revise the State Tax Code
September 4, 2001, Richmond
At the September meeting of the joint subcommittee, presentations were made by representatives of the Commission on Virginia's State and Local Tax Structure for the 21st Century based on its report and by officials from the Virginia Municipal League and the Virginia Association of Counties on the status of local revenues and services.
Tax Structure Commission
The Commission on Virginia's State and Local Tax Structure was created by the 1999 Session of the General Assembly to perform a two-year study of "all aspects of the state and local tax structure." The commission's final report (House Document 22, 2001) recommended seven broad goals and 11 specific proposals to the General Assembly.
The chairman of the 14-member citizen commission gave the joint subcommittee a general overview of the process utilized by the commission, which included numerous opportunities for public comment at various locations throughout the Commonwealth. There were seven broad goals arrived at by the commission:
1. To establish a more efficient alignment of responsibility for the provision of public services with the revenue sources required for their provision;
2. To broaden the revenue base of localities generally;
3. To recognize in the formulation of state aid programs the considerable disparity that exists in the social, economic, and fiscal condition of our political subdivisions;
4. To arrest and reverse the erosion of existing state and local revenue bases that results in an upward impetus on tax rates;
5. To establish a permanent, broad-based entity committed to a continuing analysis of state and local fiscal concerns;
6. To protect and enhance an environment in Virginia that sustains equitably our vital business community; and
7. To promote greater equity in the development and application of tax instruments for all our citizenry.
Several of the final specific recommendations of the commission stemmed from the principle embraced by the commission that taxes should be broad-based and equitable, with few if any exceptions, exclusions, or credits, thereby permitting lower rates than otherwise would be required. It was also noted that, although it may be advisable to phase-in some of the commission's recommendations over time, the bulk of the recommendations make sense only if implemented together as a package.
The commission's findings and recommendations regarding Virginia's personal income tax were presented next. The commission concluded that the personal income tax structure has become "dated." In particular, changes in income have outstripped changes to the tax structure, resulting in relatively higher tax burdens at lower income levels than was originally intended.
In this regard, the first two tax brackets ($0 to $3,000 and $3,000 to $5,000) have not been changed since they were established in 1926, and, if adjusted to 1998 dollars, those brackets would extend to $27,523 and $45,872, respectively. As a result of this fact and other considerations, the commission recommended that the rate structure be comprised of two brackets, with a rate of 5.0 percent applied to the first $50,000 of taxable income and a rate of 5.75 percent applied to amounts above $50,000.
Similarly, the commission found that the value of the tax-free amounts created by the combination of standard deductions and personal exemptions had not kept pace with incomes. In fact, for most family sizes, the current aggregate of these tax-free amounts constitutes half or less than the relevant poverty threshold. Accordingly, the commission recommended increasing the personal exemptions from $800 to $2,500 (to be instituted as $125 tax credits) and increasing the standard deduction from $3,000 ($5,000 if married filing jointly) to $3,500 ($7,000 if married filing jointly).
In addition, to promote equity among taxpayers, the commission also recommended (i) ending personal exemptions based on blindness and age, (ii) ending deductions based on age, and (iii) replacing the current low-income credit with one patterned after the federal earned income tax credit and set at 20 percent of the federal credit.
In particular, regarding the "age deduction," the commission reasoned that poverty and wealth exist at all age levels and can be measured fairly and precisely without regard to age. Therefore, introducing age (or other non-income-based preferences) as a distinct factor in computing income tax liability, "undoubtedly are popular with those whom they favor, but they come at a cost" of: (i) lower revenues available for services, (ii) higher rates on all other taxpayers, or (iii) some combination of the two. In other words, "one group's preference is another's penalty."
Virginia Municipal League
Virginia Association of Counties
Representatives from the Virginia Municipal League (VML), and the Virginia Association of Counties (VACo), made a coordinated presentation to the joint subcommittee of: (i) local governments' service responsibilities, (ii) local governments' expenditures and revenues, and (iii) a proposal for sharing a dedicated portion of the state income tax revenue with localities.
Service Responsibilities
It was explained that cities and counties are created by the state and are required to provide the services that the Commonwealth assigns to them. Table 1 provides a summary of local service responsibilities.
Table 1: Summary of Current Local Service Responsibilities
Functional Area |
Current Service Delivery and Funding Responsibility |
|
Transportation
|
|
|
Locally provided |
|
State provided |
|
|
|
Locally provided |
|
State provided |
|
State funded with a required
local match |
|
Social services |
State supervised, locally
provided |
|
Health funding |
State run at local level |
|
Environment |
State supervised, locally
provided |
|
Education |
|
|
State supervised, locally
provided |
|
Locally provided and primarily
funded |
|
Administration of justice
|
|
|
Local responsibility,
limited state oversight |
|
Local responsibility,
limited state oversight |
|
|
|
Local responsibility,
extensive state funding |
|
Local responsibility,
moderate state funding |
|
Local funding and administration
of some support positions; local funding for buildings |
|
General & financial administration |
|
|
State and locally provided |
|
State and locally funded |
Expenditures
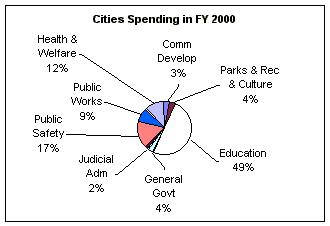
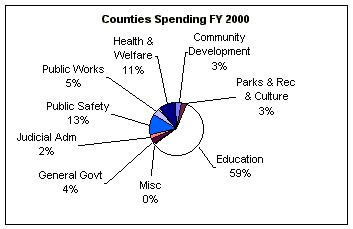
Figures 1 and 2 were presented as depicting the percentage of revenues spent by cities and counties according to service category in FY 2000.
 Figure
1
Figure
1
As shown in these charts, the largest expenditure for localities by far is for education. In this regard, one of the major concerns of VML and VACo is the need for more funding from the state for education. They emphasized that (i) local governments fund all of the costs for 20 percent of the teachers (those exceeding the Standards of Quality), (ii) local spending exceeds the state's Standards of Quality by over $2.8 billion per year (including capital outlay), and (iii) the state funds only about 12 percent of capital outlay for schools (including the state's new commitment for such funding).
 Figure
2
Figure
2
Revenues
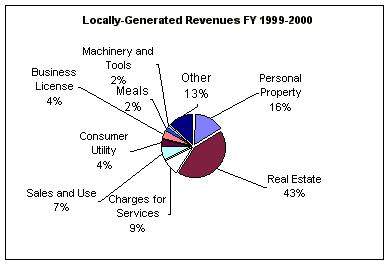
Of the total revenues spent by localities, 62 percent is locally generated through local taxes and fees, 32 percent comes from the Commonwealth, and 6 percent comes from the federal government. Figure 3 was presented as depicting the particular sources of the locally generated taxes and fees.
 Figure
3
Figure
3
It was emphasized that Figure 3 depicts the average for all localities and therefore understates or overstates the reliance of particular localities on particular taxes and fees. However, in general, localities are heavily dependent on real estate taxes, and such tax revenues, according to VML and VACo, are growing at a slower rate than the state's income tax revenues.
Income Tax Sharing
To provide localities with additional revenues from a source that "grows with the economy," VML and VACo proposed that the Commonwealth return to localities 10 percent of the state individual income tax revenues, to be phased in over a five-year period. Under this proposal these revenues (estimated to be approximately $800 million in FY 2002) would be distributed to localities according to the following formula: (i) 50 percent based on the relative share of the total state income tax paid by taxpayers filing returns in each locality, (ii) 40 percent based on where wages are earned, and (iii) 10 percent divided equally among all cities and counties.
Next Meeting
The next meeting of the joint subcommittee will be November 13, 2001, at 1:30 p.m. in House Room C of the General Assembly Building. The Virginia Chamber of Commerce will make a presentation that was postponed from the September meeting. In addition, other interested and invited parties will be able to present their comments regarding the joint subcommittee's work. Finally, staff will present information responding to certain questions and requests for information from joint subcommittee members at the August and September meetings.
The Honorable Emmett W. Hanger, Co-chairman
The Honorable Robert F. McDonnell, Co-chairman
Legislative Services contact: Joan E. Putney
Mark
Vucci
David
Rosenberg